
A response variable is one of the most common terms in statistics and research. It helps researchers measure the result of an experiment, study, or investigation. However, many students find it difficult to tell the difference between a response variable and an independent variable.
The response variable definition is simple: it is the variable that researchers measure to find out what happens during a study. Its value may change based on another variable, such as the amount of exercise, hours of study, or temperature.
In this guide, you will learn what a response variable means, how to identify one, how it differs from an explanatory variable, and how to use it in real-life examples.
What Is a Response Variable?
A response variable is the outcome or result that a researcher measures in a study or experiment. It is the variable that researchers want to explain, predict, or study.
It is also called a dependent variable or outcome variable.
For example, a teacher wants to find out whether students who study longer get better test scores. The teacher records the number of hours each student studies and their final test scores.
In this situation:
- Hours of study: Explanatory variable
- Test scores: Response variable
The test score is the response variable because it is the result being measured.
A response variable can be a number, a category, or a yes-or-no result. Its type depends on the question being studied.
Example 1:
A researcher studies whether daily exercise affects a person’s heart rate. The researcher measures each person’s heart rate after exercise.
The heart rate is the response variable because it is the result the researcher measures. The amount of exercise is the explanatory variable.
Why Is a Response Variable Important?
A response variable helps researchers focus on the result they want to study. Without it, they may collect information that does not answer their main research question.
It also helps researchers:
- Measure the results of an experiment.
- Compare different groups.
- Study relationships between variables.
- Create graphs and statistical models.
- Make predictions based on collected data.
- Check whether a treatment or change has an effect.
For example, a company may want to know whether changing its website layout increases sales. It can compare the number of sales before and after the change.
In this study, the number of sales is the response variable.
Example 2:
A farmer tests two types of fertilizer to find out which one helps plants grow taller. The farmer measures the height of each plant after six weeks.
The plant height is the response variable because it shows the result of using the fertilizer.
Response Variable vs. Independent Variable
The main difference between these two variables is their role in a study.
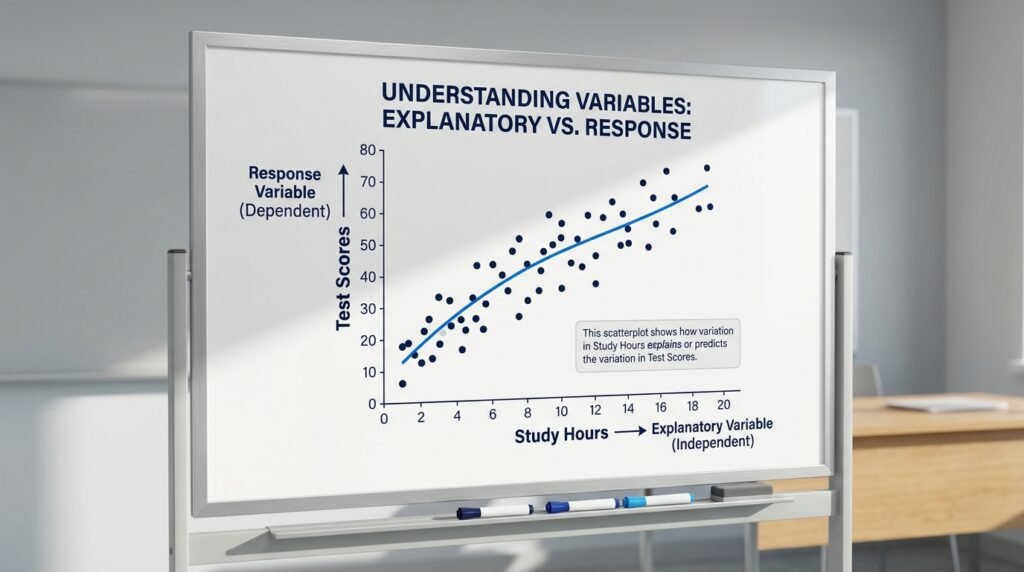
An independent variable is the variable that researchers change, select, or use to explain or predict another variable. A response variable is the outcome they measure.
For example, if a researcher wants to know whether sleep affects test performance, the number of hours of sleep is the independent or explanatory variable. The test score is the response variable.
| Feature | Response Variable | Independent Variable |
|---|---|---|
| Main role | Measures the outcome | Explains or predicts the outcome |
| Other name | Dependent variable | Explanatory variable |
| Main purpose | Shows what happened | Shows what may influence the result |
| Common graph position | Y-axis | X-axis |
| Example | Test score | Hours studied |
The independent variable is often written as X, while the response variable is often written as Y in a basic statistical model.
However, the names depend on the research question. The same variable can have different roles in different studies.
Example 3:
A school studies whether students who spend more time reading have a larger vocabulary. Researchers record reading time and vocabulary test scores.
Here, reading time is the explanatory variable, while vocabulary test scores are the response variable.
The scores are the result researchers want to explain.
Common Examples of Response Variables
Response variables appear in education, healthcare, business, agriculture, science, and everyday research.
Here are some examples:
| Research Question | Explanatory Variable | Response Variable |
|---|---|---|
| Does studying affect exam results? | Hours studied | Exam score |
| Does exercise affect heart rate? | Exercise duration | Heart rate |
| Does fertilizer affect plant growth? | Fertilizer amount | Plant height |
| Does advertising increase sales? | Advertising spending | Sales revenue |
| Does temperature affect ice cream sales? | Daily temperature | Ice cream sales |
| Does sleep affect concentration? | Hours of sleep | Concentration score |
| Does training improve running speed? | Training time | Running time |
These examples show that the response variable is the result researchers want to measure.
1. Education Example
A school wants to know whether extra study time improves student performance.
The researchers record how many hours students study each week and their final exam scores.
- Explanatory variable: Weekly study hours
- Response variable: Final exam score
Example 4:
A student studies for three hours each evening and receives a score of 90 on a mathematics test.
The test score is the response variable because it shows the student’s result. Study time is the explanatory variable being compared with that result.
2. Healthcare Example
A healthcare researcher wants to study whether daily walking affects blood pressure.
The researcher records how long each participant walks and measures their blood pressure.
- Explanatory variable: Daily walking time
- Response variable: Blood pressure
Example 5:
A researcher compares the blood pressure readings of people who walk for 15, 30, and 45 minutes each day.
The blood pressure reading is the response variable because it is the measured result.
3. Business Example
A business owner wants to know whether spending more money on advertising leads to higher sales.
The owner records advertising costs and monthly sales revenue.
- Explanatory variable: Advertising spending
- Response variable: Monthly sales revenue
Example 6:
A store spends $500 on advertising in one month and records $4,000 in sales revenue.
The sales revenue is the response variable because it is the business result being studied.
4. Agriculture Example
A farmer wants to compare how different amounts of water affect crop growth.
The farmer gives different groups of plants different amounts of water and measures their final height.
- Explanatory variable: Amount of water
- Response variable: Final plant height
Example 7:
One group of plants receives 500 milliliters of water each week, while another group receives 700 milliliters. The farmer measures their height after one month.
The final plant height is the response variable because it shows the result of the different watering amounts.
How to Identify a Response Variable
You can identify a response variable by looking at the main question of a study.
Ask yourself: What result does the researcher want to measure or predict?
The answer is usually the response variable.
Follow these simple steps:
Step 1: Read the Research Question
Find out what the researcher wants to investigate.
For example:
Does the amount of sleep affect students’ test scores?
Step 2: Find the Possible Influencing Variable
Look for the variable that may explain or predict a change in another variable.
In this example, it is the number of hours students sleep.
Step 3: Find the Measured Result
Ask what the researcher will measure as the outcome.
Here, the researcher will measure students’ test scores.
Step 4: Identify the Response Variable
The test score is the response variable because it is the outcome being studied.
Example 8:
A researcher wants to find out whether room temperature affects how quickly ice melts. The researcher records the room temperature and measures the time it takes for the ice to melt.
The melting time is the response variable because it is the result being measured. Room temperature is the explanatory variable.
Types of Response Variables
A response variable can have different forms depending on the information researchers collect.

The two common types are quantitative and categorical variables.
1. Quantitative Response Variable
A quantitative response variable contains numerical values. These values represent amounts, measurements, or counts.
Examples include:
- Height in inches or centimeters.
- Weight in pounds or kilograms.
- Test scores.
- Monthly income.
- Blood pressure readings.
- Time taken to complete a task.
Example 9:
A researcher measures the running times of 20 athletes after a training program.
The athletes’ running times are the quantitative response variable because they are recorded as numbers.
2. Categorical Response Variable
A categorical response variable places results into groups or categories rather than measuring them as numerical amounts.
Examples include:
- Yes or no.
- Pass or fail.
- Improved or not improved.
- Customer satisfied or dissatisfied.
- Product defective or not defective.
Example 10:
A company checks whether each product passes or fails a quality test.
The quality test result is the categorical response variable because each product belongs to one of two groups.
Response Variable in Experiments
In an experiment, researchers often change one condition and measure the result.
The variable they change or assign is the explanatory variable. The result they measure is the response variable.
For example, a scientist tests whether different amounts of sunlight affect plant growth.
The scientist gives each group of plants a different number of hours of sunlight. After four weeks, the scientist measures plant height.
- Explanatory variable: Hours of sunlight
- Response variable: Plant height
A good experiment uses a clear method to measure the response variable. Researchers should also try to keep other conditions similar when those conditions could affect the results.
Example 11:
A scientist grows two groups of plants under different lighting conditions and measures how much each plant grows in four weeks.
The amount of plant growth is the response variable because it is the main result being compared.
Response Variable in Regression Analysis
A response variable in regression is the outcome that a statistical model tries to explain or predict.

Regression analysis studies how one or more explanatory variables relate to a response variable.
For example, a real estate researcher may want to predict the selling price of a house using its size, age, and location.
In this study:
- Response variable: House selling price
- Explanatory variables: House size, age, and location
A simple linear regression model is often written as:
Y = a + bX + e
Where:
- Y: Response variable
- X: Explanatory variable
- a: Intercept
- b: Slope or estimated change in Y for a one-unit change in X
- e: Error term
The equation helps researchers describe or predict the response variable using the explanatory variable.
Example 12:
A researcher uses the size of a house in square feet to predict its selling price.
The selling price is the response variable because it is the value the model aims to predict.
Where Is the Response Variable Placed on a Graph?
In a standard scatterplot, the response variable is usually placed on the Y-axis, which is the vertical axis.
The explanatory variable is usually placed on the X-axis, which is the horizontal axis.
For example, imagine a graph that shows the relationship between study hours and test scores.
- X-axis: Hours studied
- Y-axis: Test scores
Each point on the graph represents one observation, such as one student’s study time and test score.
This setup makes it easier to see whether changes in the explanatory variable are related to changes in the response variable.
Example 13:
A teacher creates a scatterplot showing the study hours and exam scores of 30 students.
The exam scores appear on the Y-axis because they are the response variable. Study hours appear on the X-axis.
Common Mistakes When Identifying a Response Variable
Students sometimes confuse response variables with other types of variables. Here are some mistakes to avoid.
1. Choosing the Wrong Variable
Do not automatically select the variable that appears first in a research question.
Instead, ask which result the researcher wants to measure.
2. Confusing the Response Variable With the Explanatory Variable
The explanatory variable is used to explain or predict the result. The response variable is the result being measured.
For example, in a study of exercise and weight loss, exercise time is the explanatory variable and weight change is the response variable.
3. Assuming Every Response Variable Must Be Numerical
A response variable can be numerical or categorical.
For example, a study may measure whether a patient recovered or did not recover. This is a categorical response variable.
4. Assuming a Relationship Always Proves Cause and Effect
A relationship between two variables does not automatically prove that one causes the other.
For example, ice cream sales and swimming activity may both increase during hot weather. This does not mean buying ice cream causes people to swim.
Other factors may explain the relationship.
Researchers need suitable study methods before making claims about cause and effect.
5. Thinking a Variable Always Has the Same Role
A variable’s role depends on the research question.
For example, a study may use age to predict income. Another study may use income to predict spending.
The same variable can serve as a response variable in one study and an explanatory variable in another.
Frequently Asked Questions About Response Variables
What is a response variable in simple words?
A response variable is the result a researcher measures in a study. For example, if a teacher studies whether study time affects exam performance, the exam score is the response variable.
What is another name for a response variable?
A response variable is also called a dependent variable or outcome variable. In some statistical settings, it is also called the predicted variable.
Is the response variable dependent or independent?
The response variable is commonly called the dependent variable because its value is studied in relation to one or more explanatory variables.
What is the difference between a response variable and an explanatory variable?
An explanatory variable is used to explain or predict changes in another variable. A response variable is the outcome being measured.
For example, hours of exercise may be the explanatory variable, while heart rate is the response variable.
Is the response variable X or Y?
In a standard two-variable graph, the response variable is usually represented by Y, while the explanatory variable is represented by X.
Can a study have more than one response variable?
Yes. A study can have multiple response variables if researchers want to measure several outcomes.
For example, a fitness study may measure both weight change and resting heart rate after an exercise program.
Is a response variable always numerical?
No. A response variable can be quantitative or categorical.
Examples of numerical outcomes include height and test scores. Examples of categorical outcomes include pass or fail and yes or no.
How do you find the response variable in a word problem?
Read the question and identify the result the researcher wants to measure or predict. That result is usually the response variable.
For example, if a question asks whether temperature affects ice cream sales, ice cream sales is the response variable.
Is the response variable always on the Y-axis?
In a standard scatterplot, the response variable is usually placed on the Y-axis. However, graph formats and study methods can differ, so always check the labels and purpose of the graph.
Does a response variable prove that one thing causes another?
No. Identifying a response variable does not prove cause and effect. Researchers need an appropriate study design and evidence before making a causal claim.
Conclusion
A response variable is the outcome that researchers measure in a study, experiment, or statistical analysis. It is also known as the dependent variable or outcome variable.
To identify it, look for the result the researcher wants to explain, measure, or predict. In a standard scatterplot, it usually appears on the Y-axis, while the explanatory variable appears on the X-axis.
Once you learn this simple difference, it becomes much easier to read research questions, identify variables, and work with basic statistics. Practice with everyday examples, such as study hours and test scores, to build your skills.

Emily Carter (Content Writer & Communication Specialist) is a content writer and communication specialist at AllTypeInfo.com. She writes clear, practical, and easy-to-follow guides on email responses, message replies, writing templates, and everyday communication tips. Her goal is to help readers communicate with confidence in both personal and professional settings.